Field note 01Marketing analytics

Find the pressure behind the spike.

Bipaqero turns scattered channel evidence into a field map for one decision. Start with the question, inspect the source and agree on what would change next.
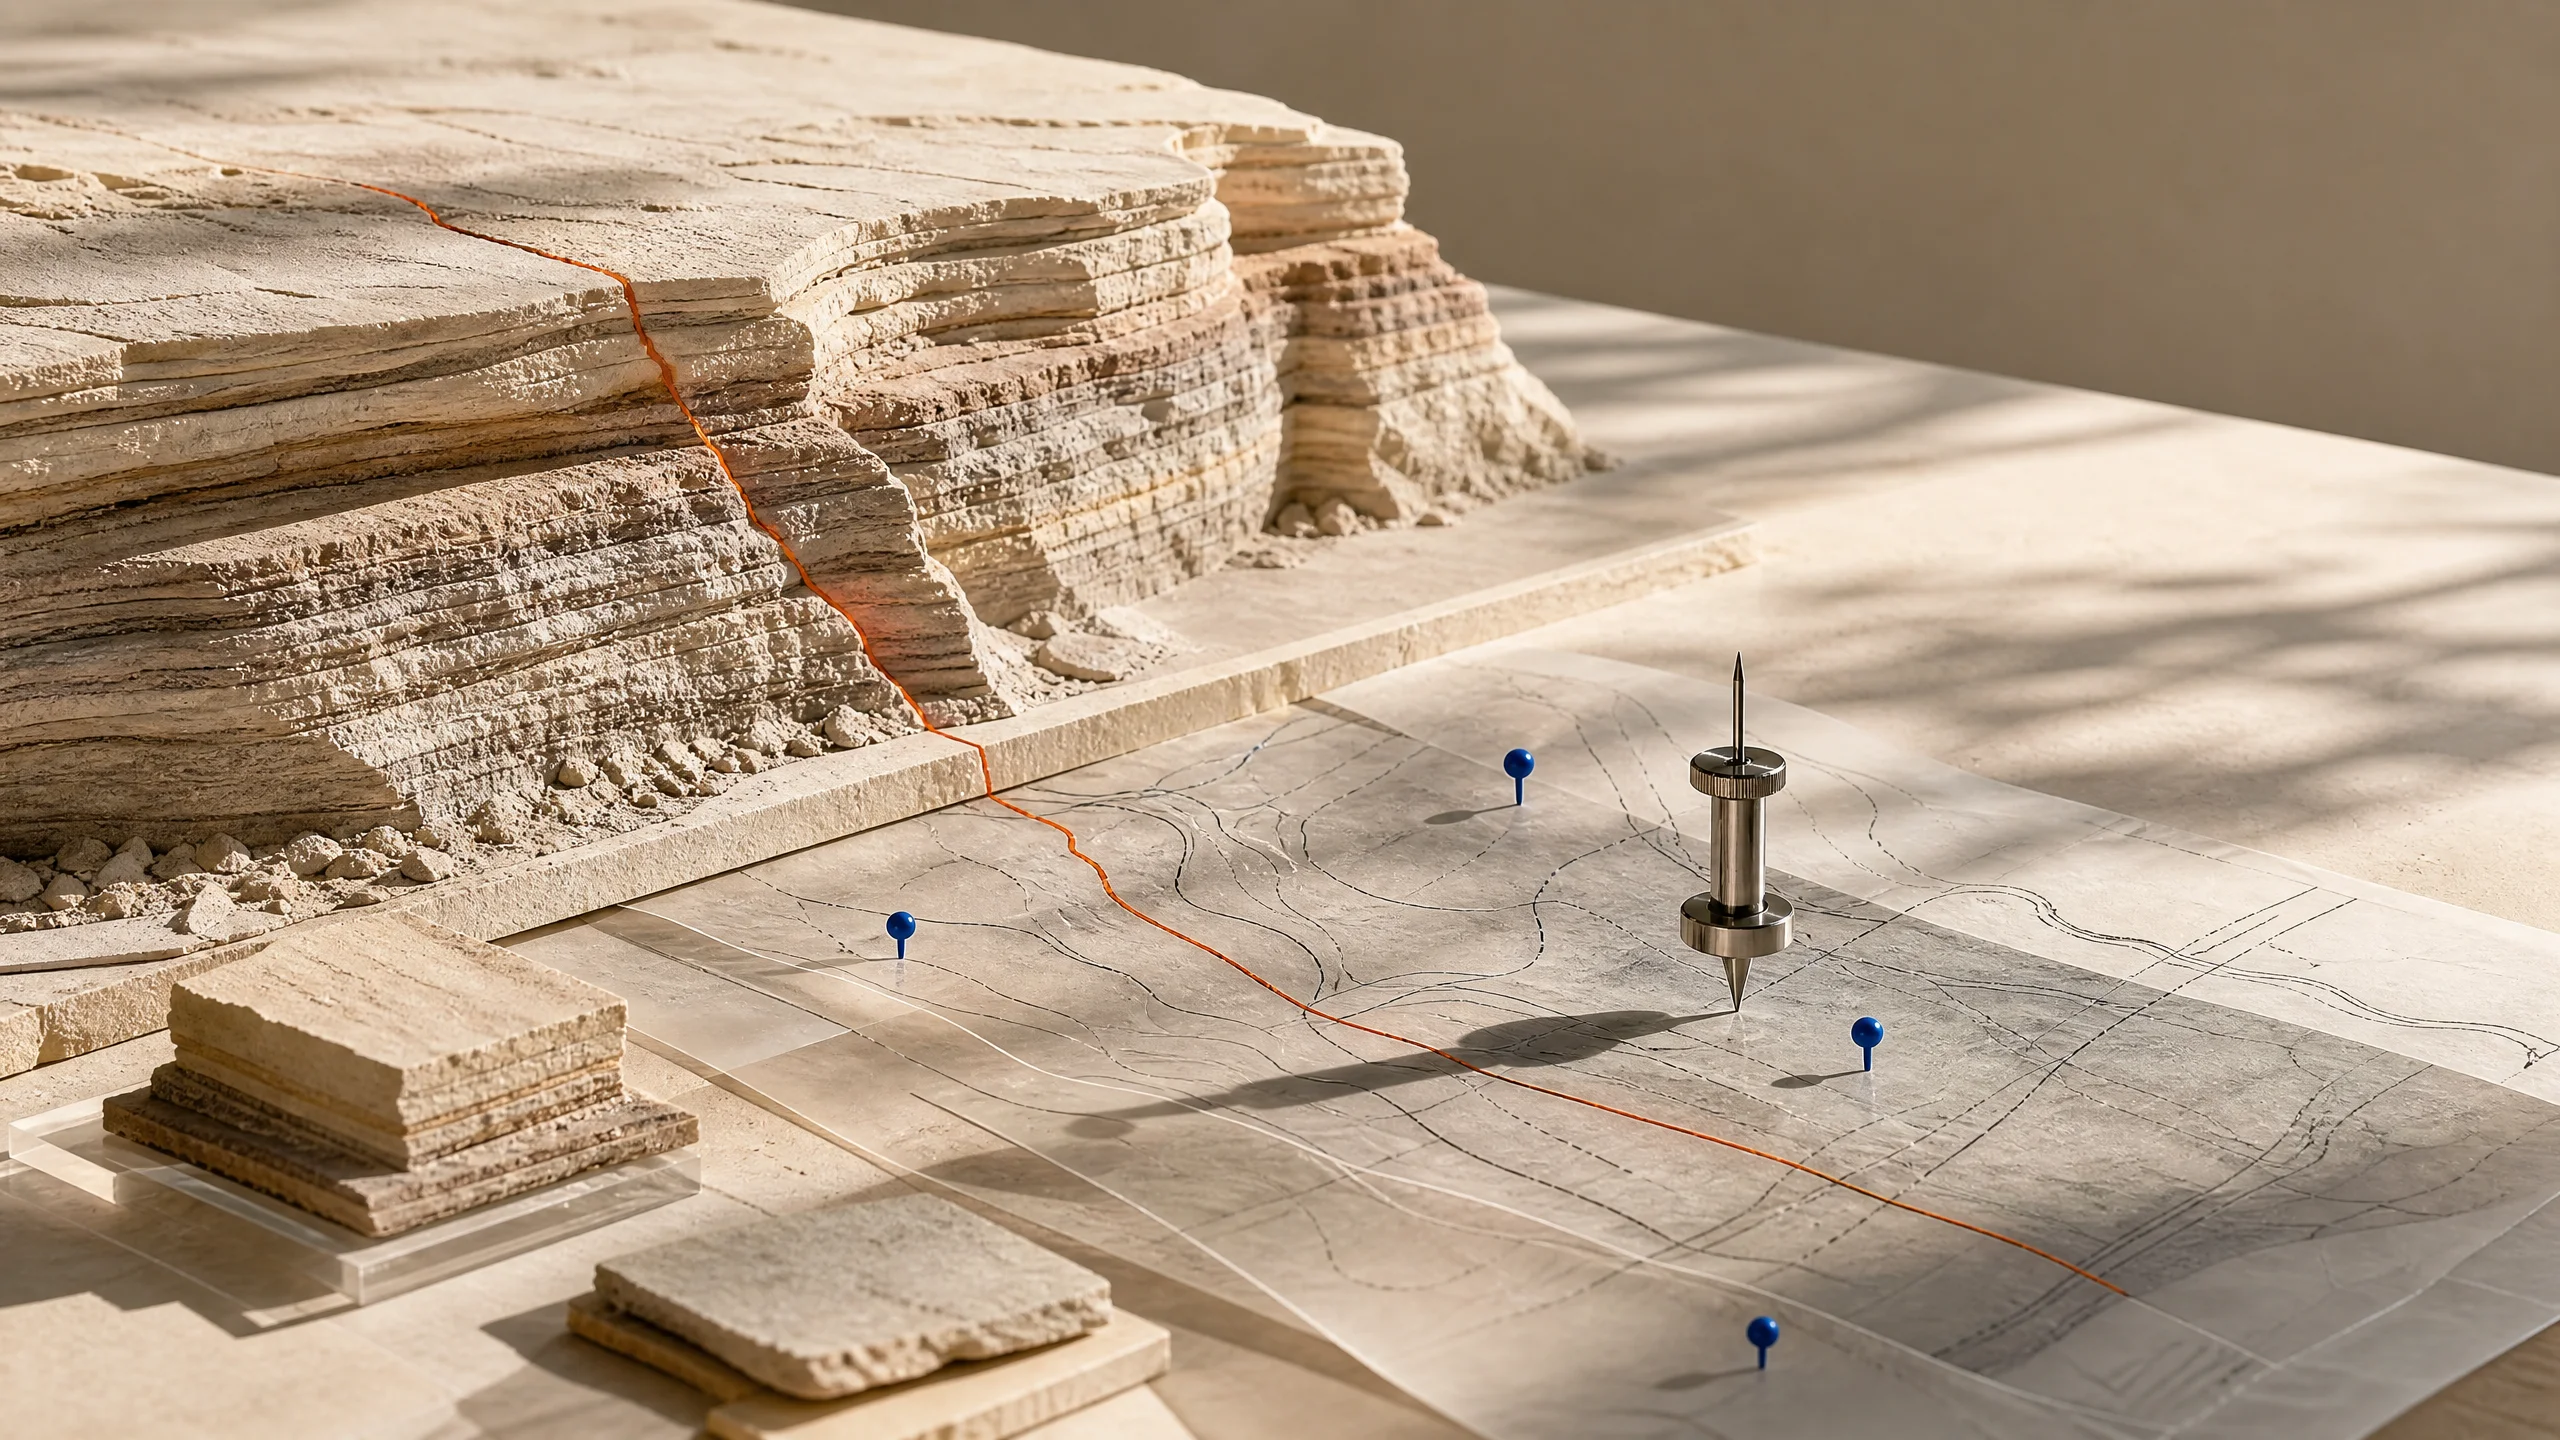
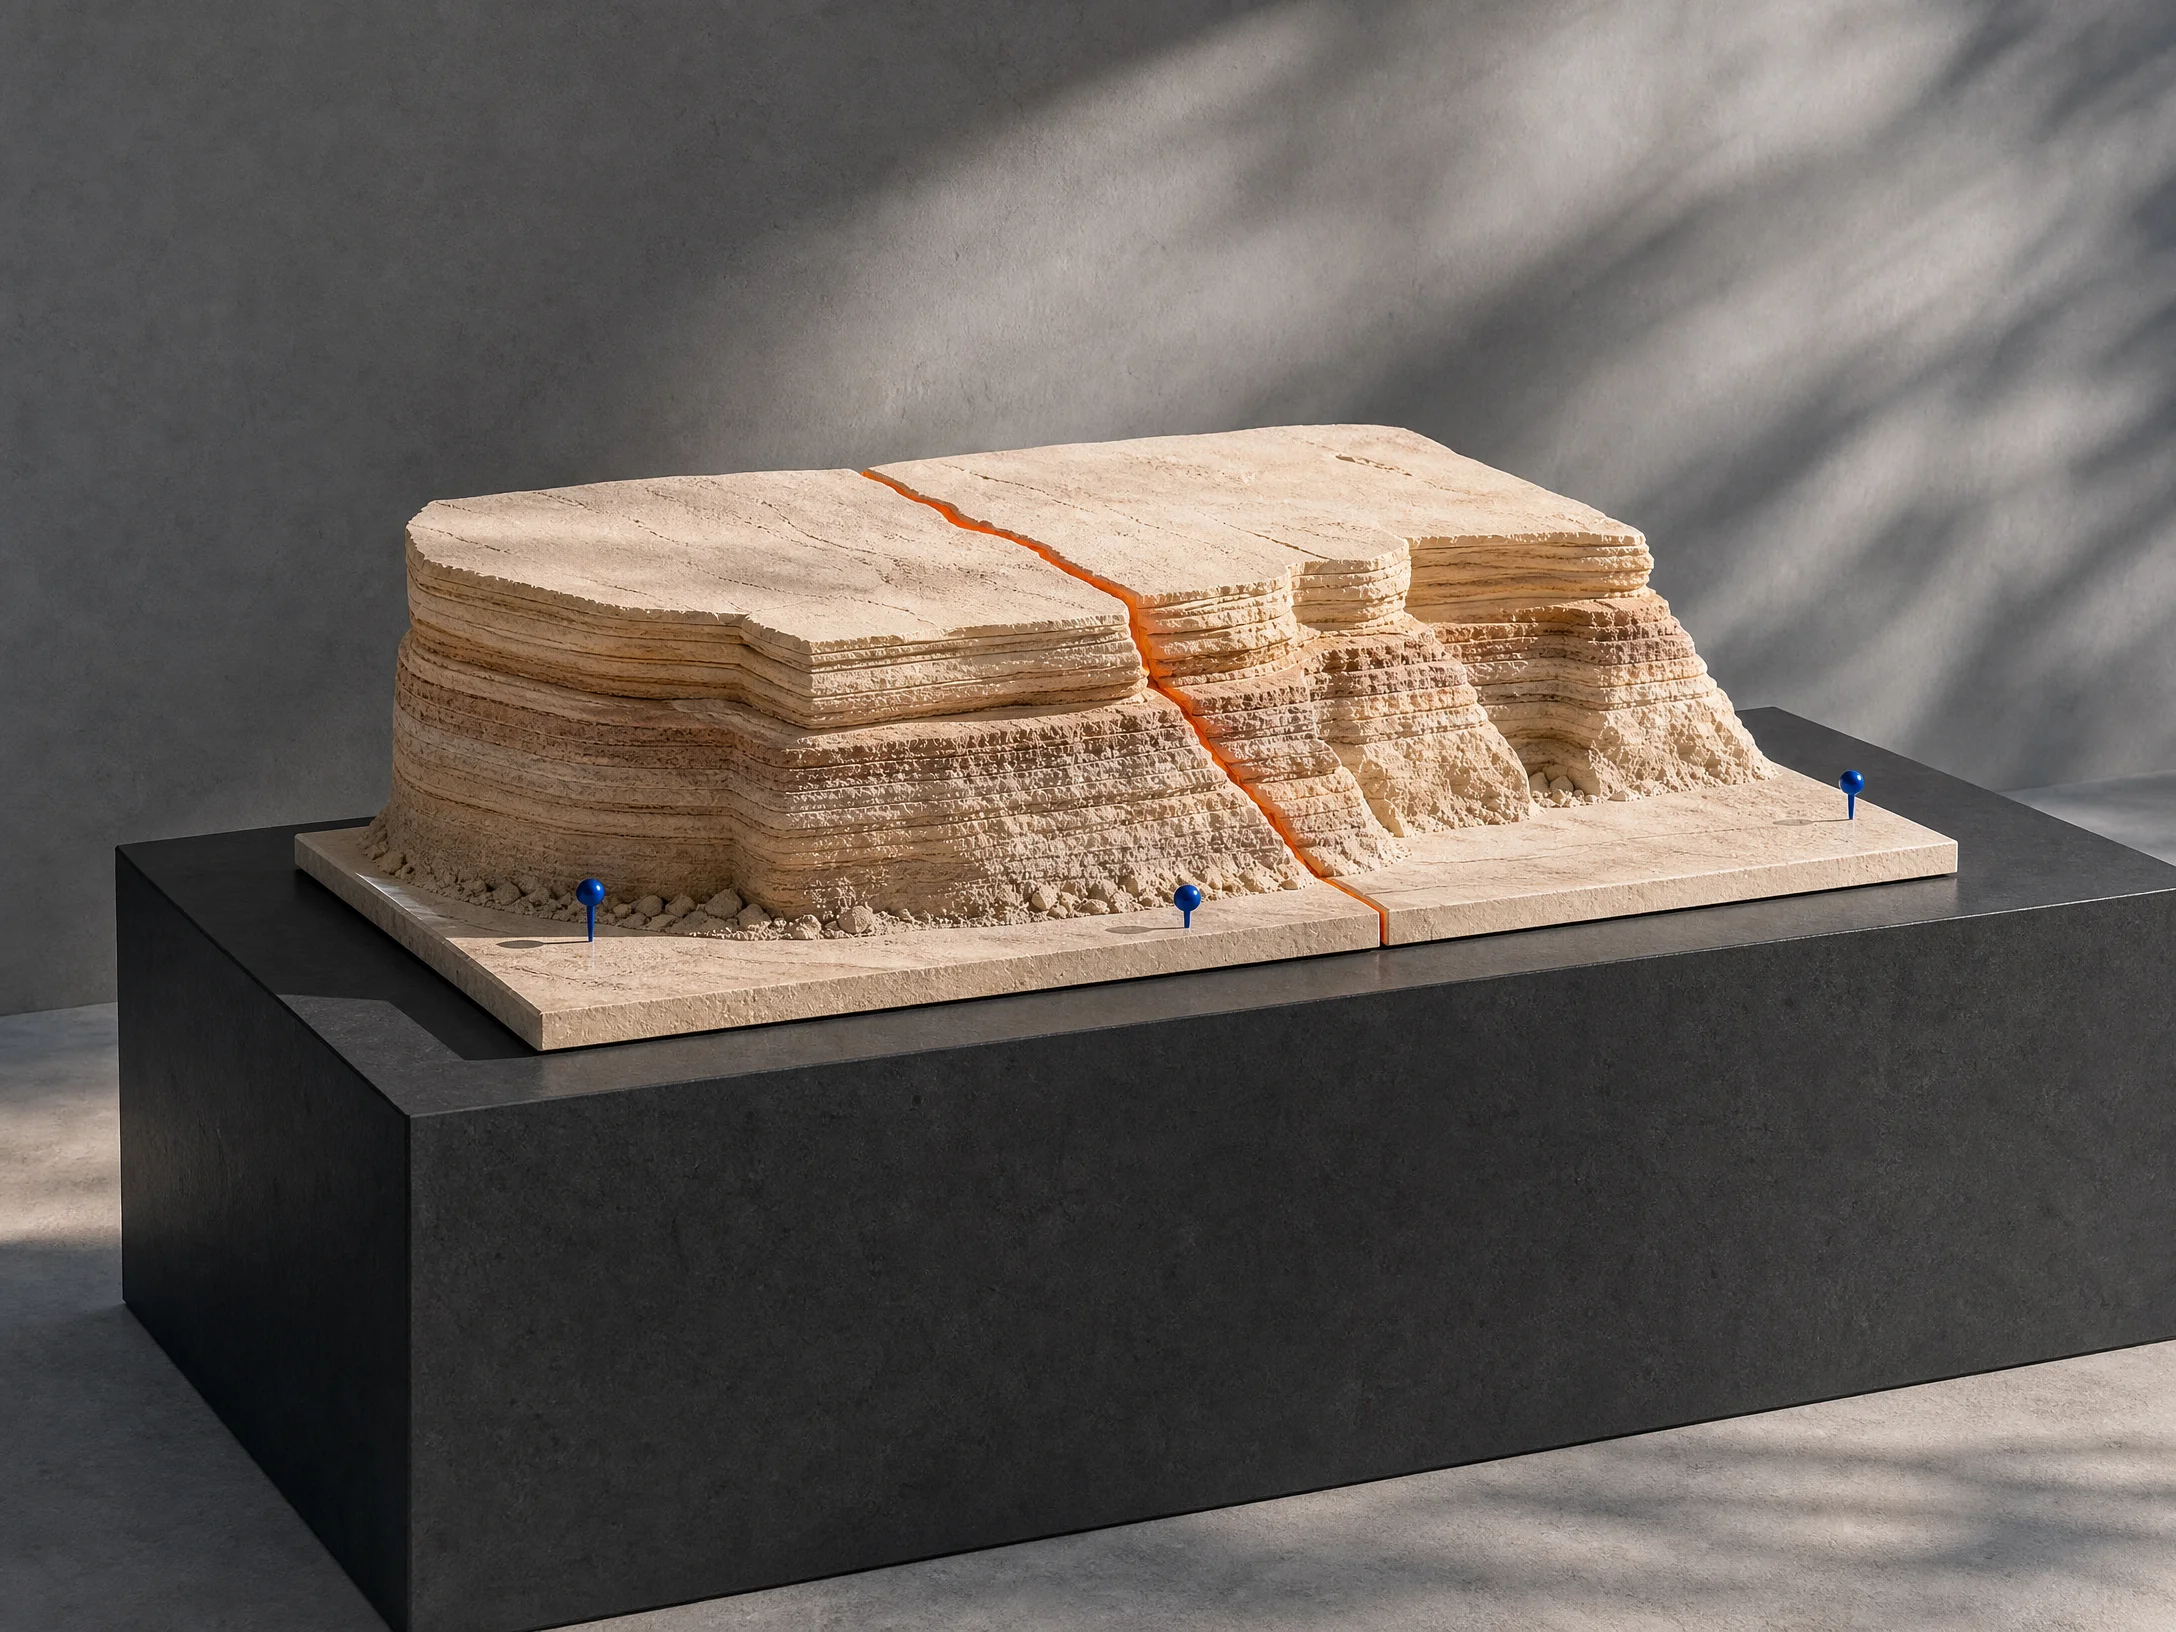
Physical geological market map with layered terrain and survey pins
Survey plate AOne question / multiple traces
01
State the decision before selecting a metric.
02
Separate source quality from signal strength.
03
Set a threshold that has an owner.
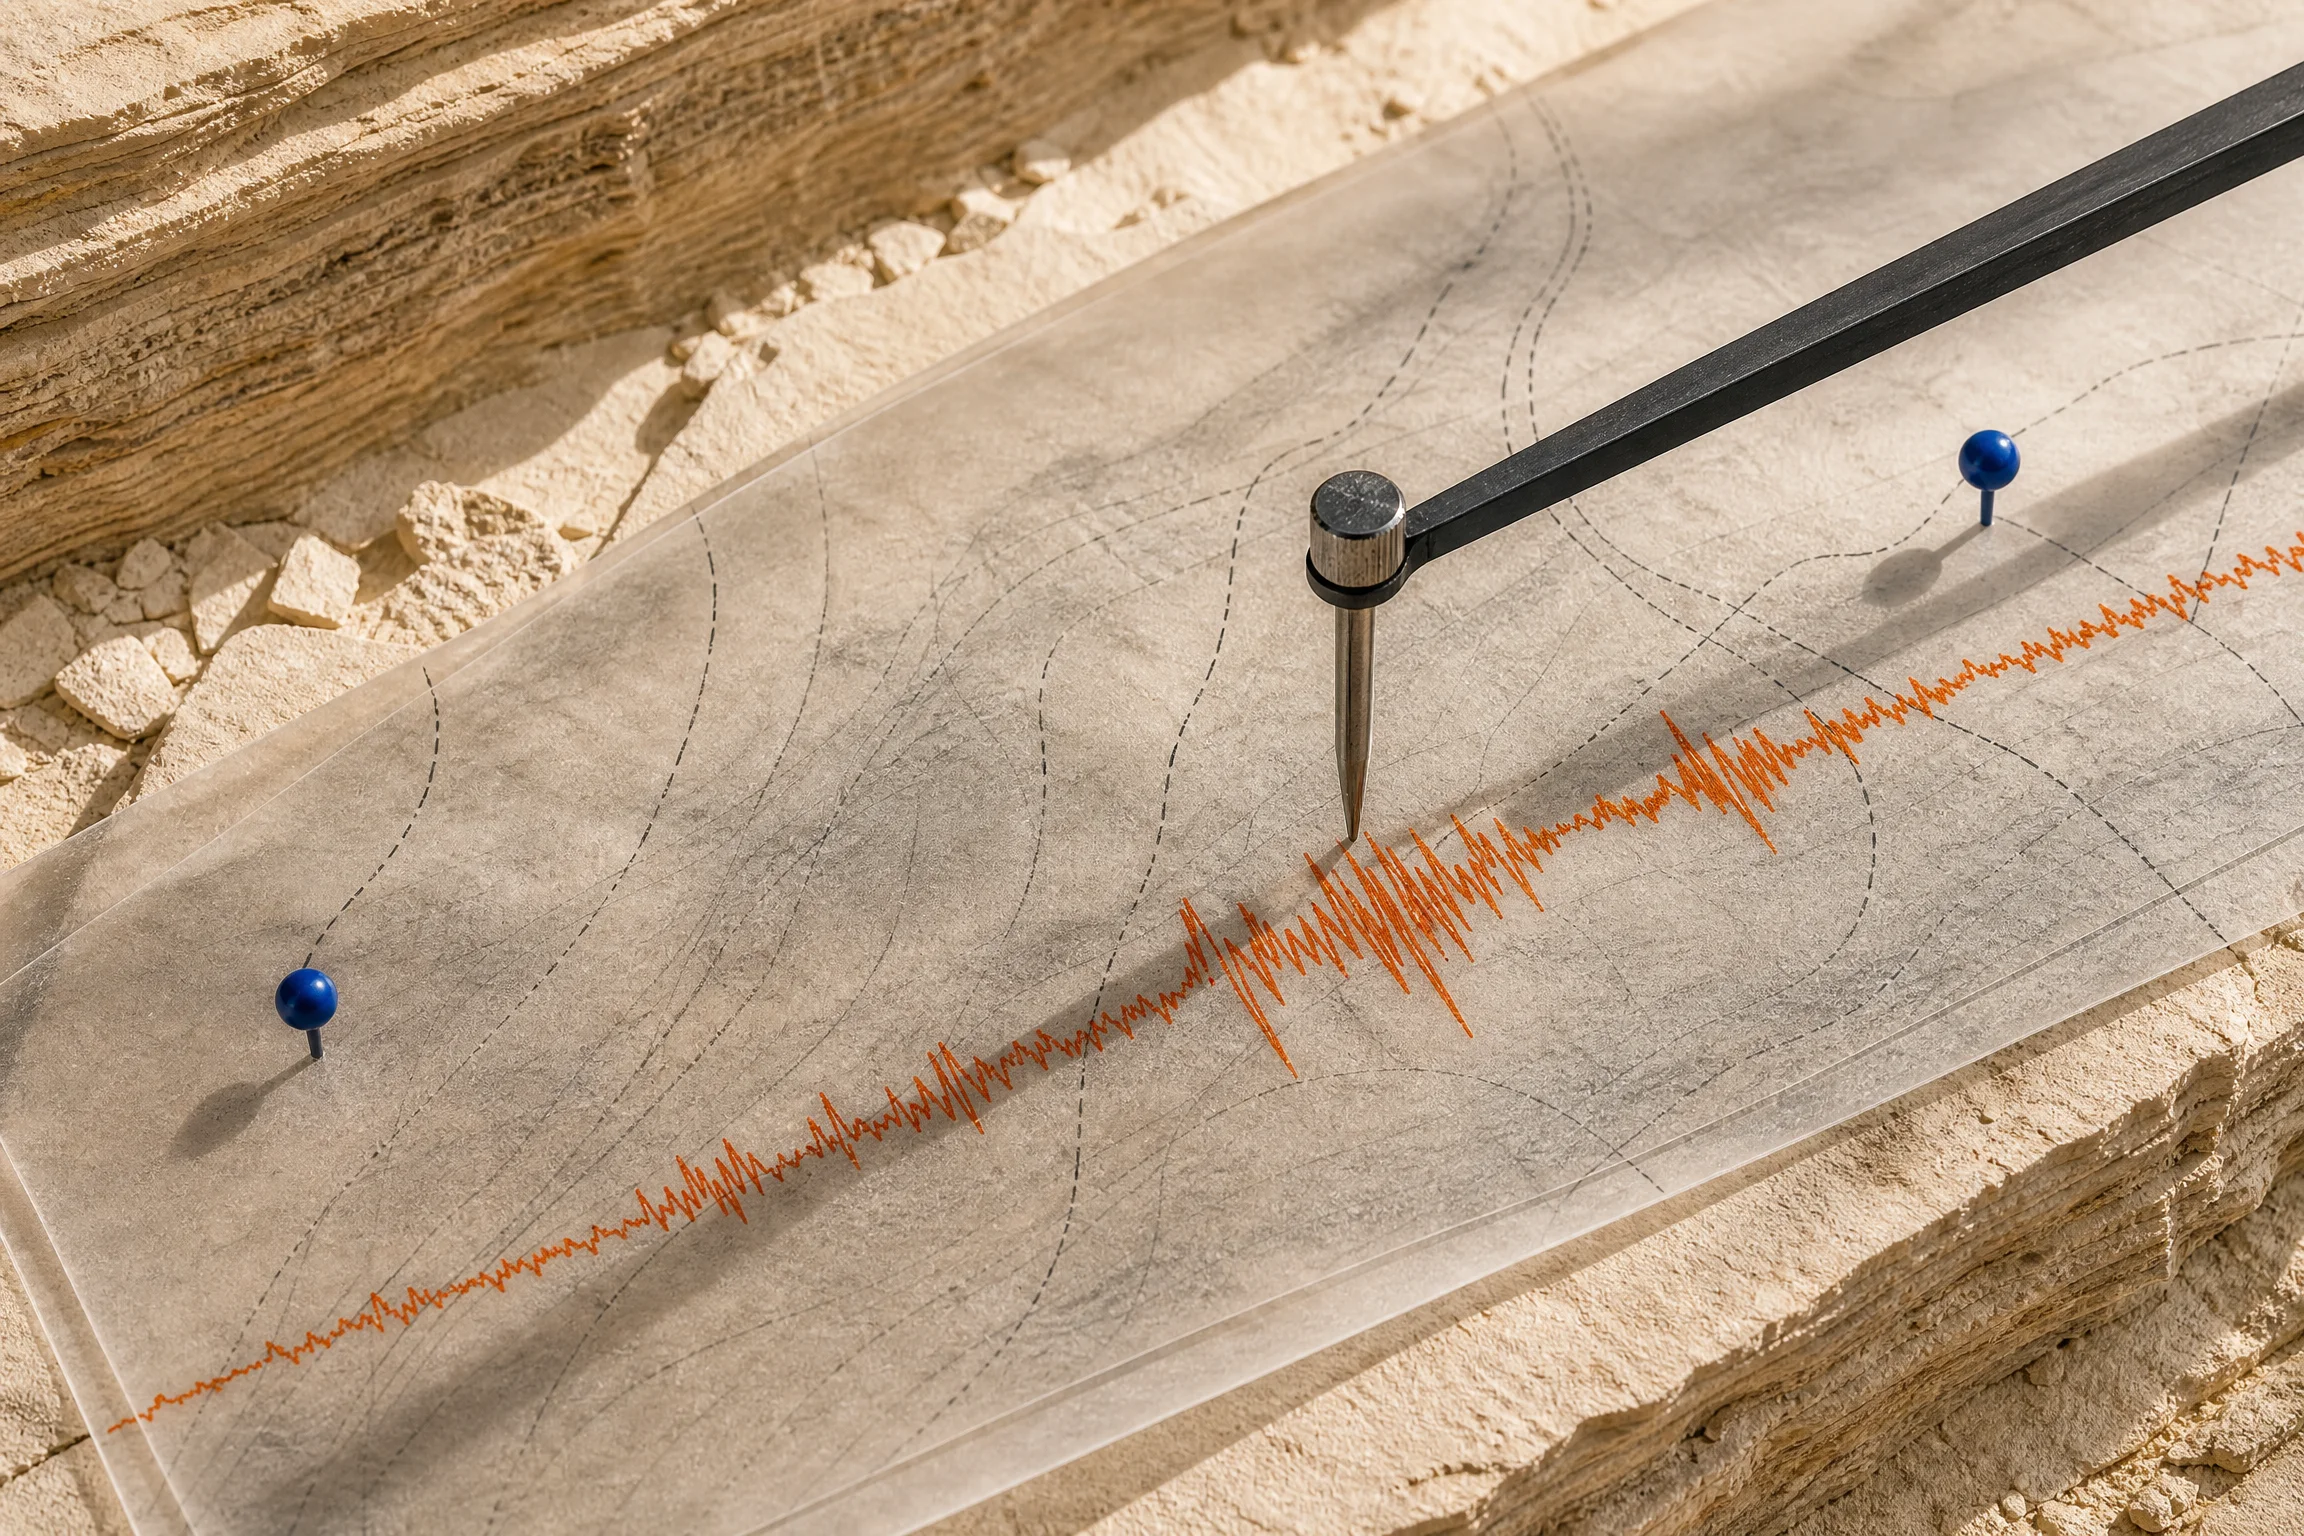
Close-up seismic trace drawn across a layered marketing field map
Live traceChoose the pressure first

What moved—and what merely arrived at the same time?

Working interpretationCompare the change against an unchanged audience and a stable tracking window.

That keeps demand evidence separate from distribution effects.

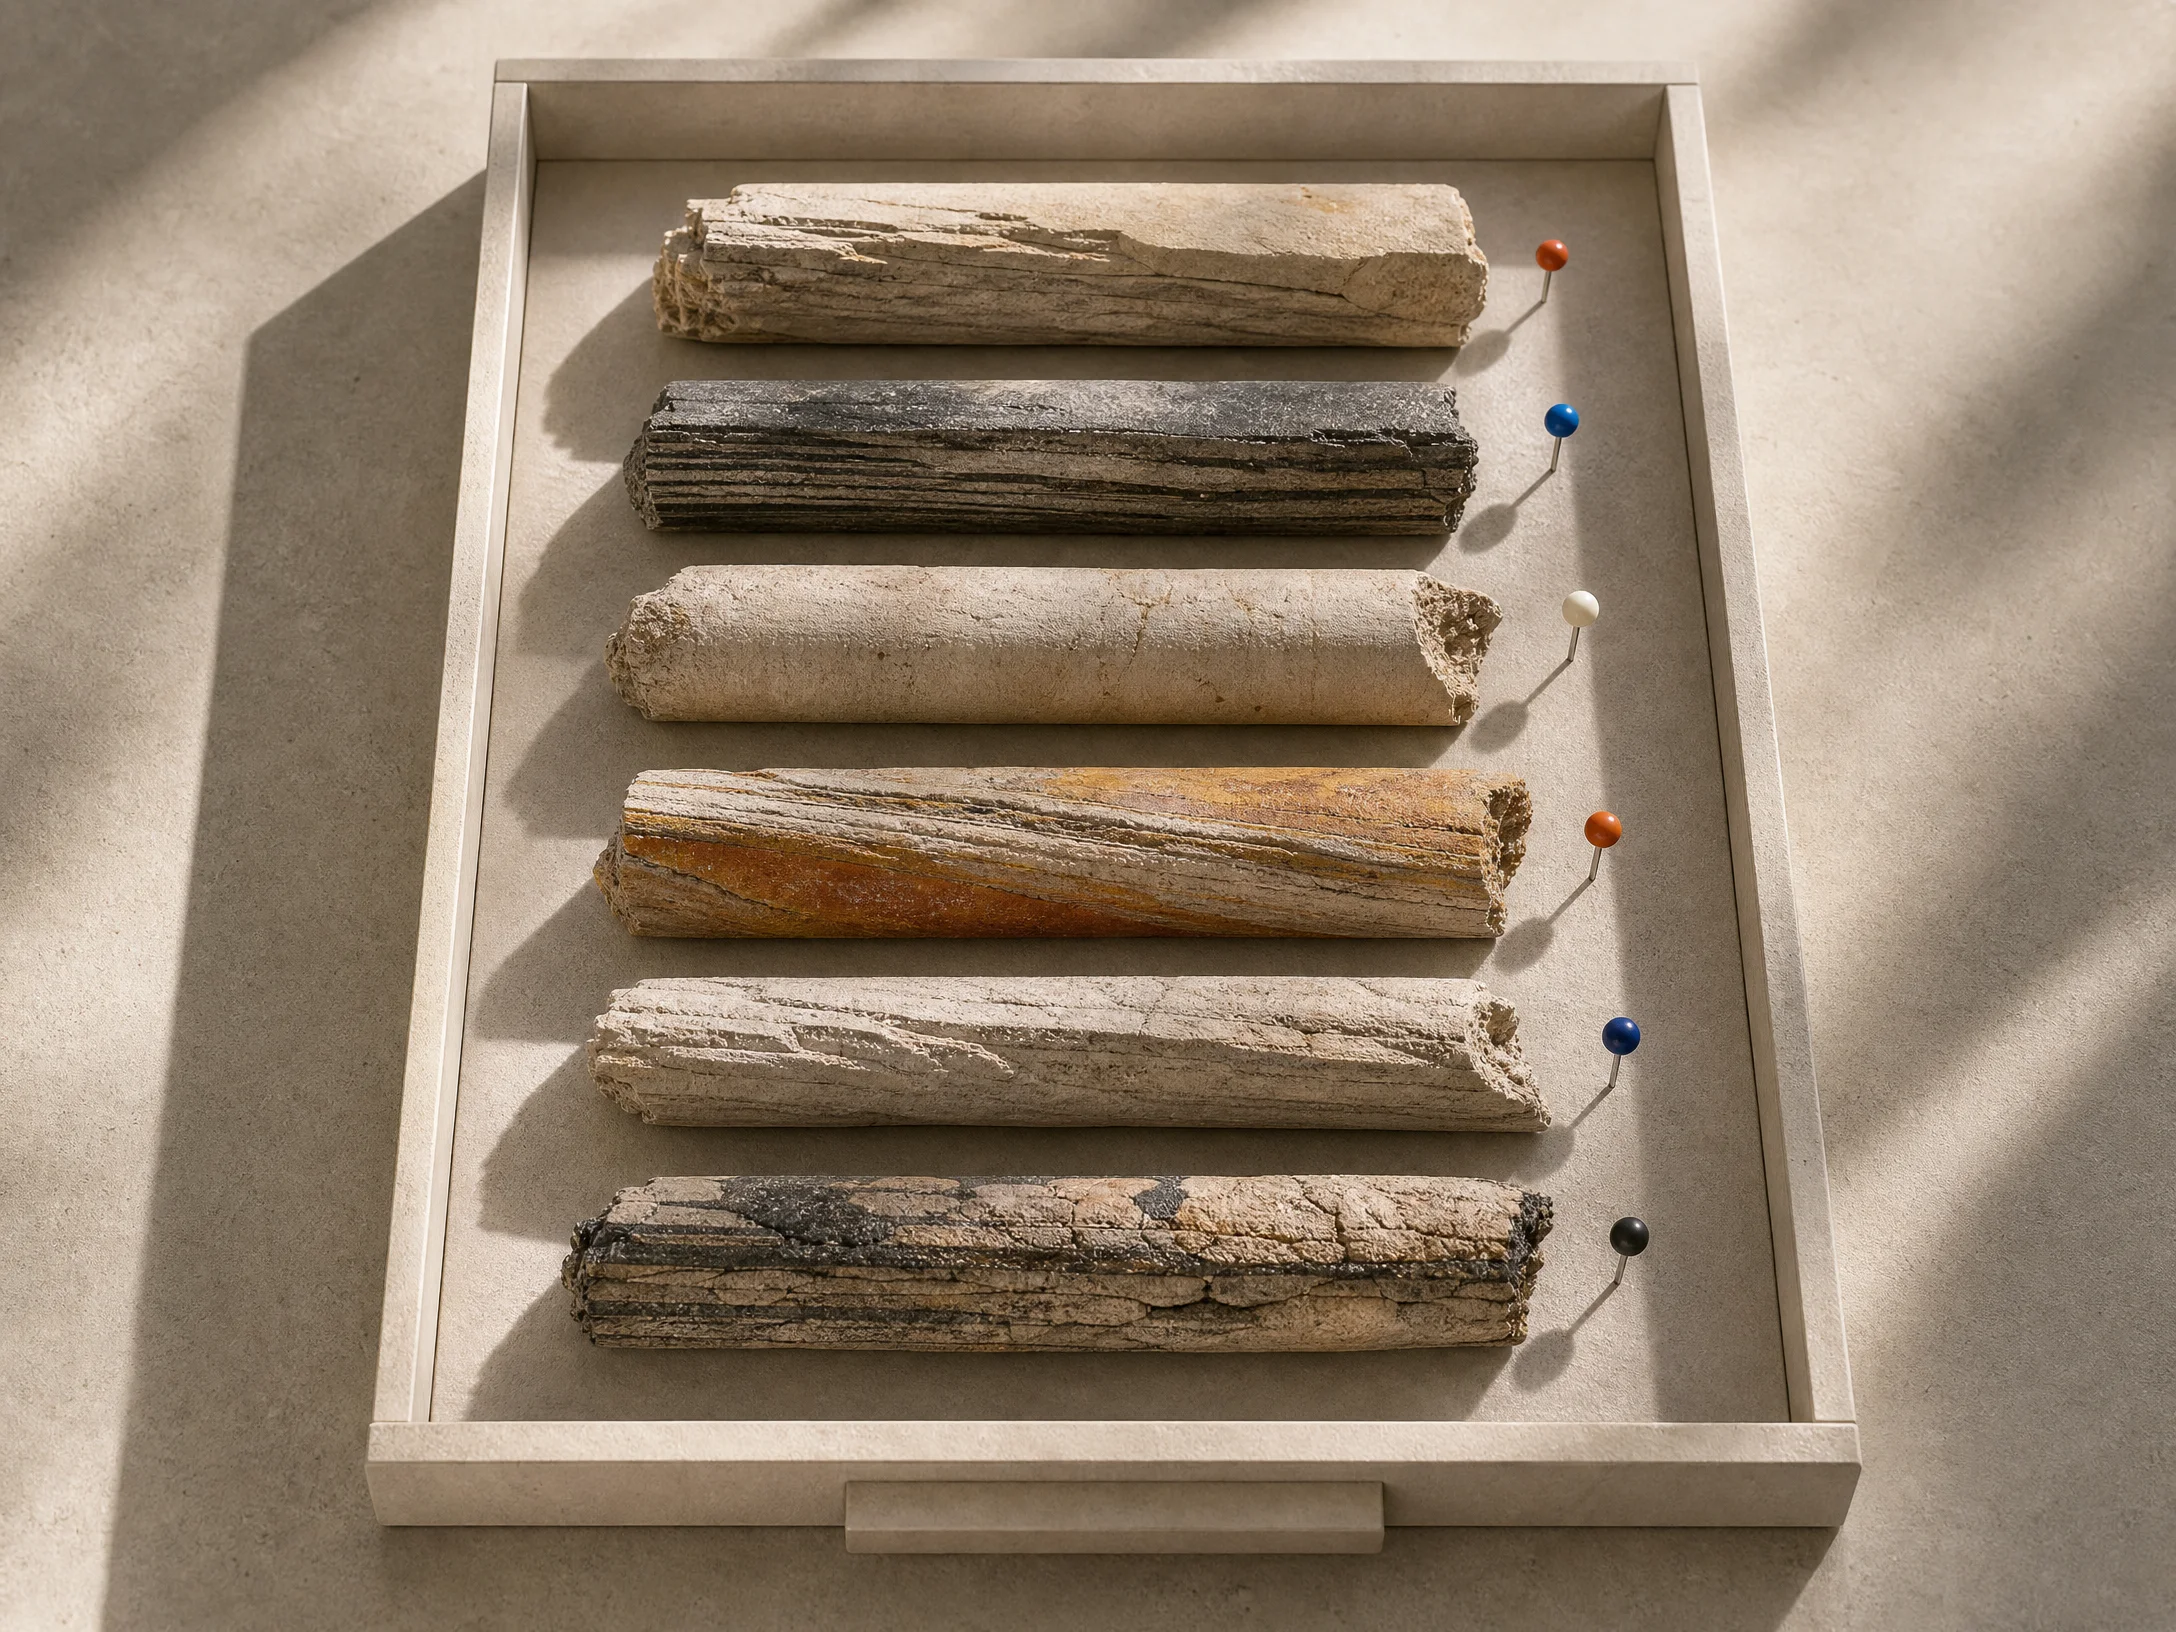
Source core atlasEvidence before explanation

Inspect the layer that produced the number.

Two sources can report the same movement while describing different behaviour. Select a plate to change the field note, then compare both physical models.

Channel core / current note

Check whether delivery changed before assigning the movement to creative.

Review audience overlap, placement mix and identity loss beside the reported conversion shift.
  • Keep one stable comparison.
  • Record missing identities.
  • Name the next decision.
Organised geological source cores representing marketing evidence layers
Core traySource integrity
Layered fault model representing a customer journey break
Fault modelJourney handoff
Tremor ReaderThree inputs / one decision

Build a reading that can be challenged.

Choose the operating question, evidence layer and observation window. The reader returns a bounded interpretation—not a promise.

Field reading

Treat the movement as a demand hypothesis.

Compare observed behaviour with a stable channel baseline before changing the campaign plan.

Bounded claimNamed comparisonDecision owner
Layered physical tremor reader instrument with a survey pin
Instrument 03Interpretation chamber
Evidence sampleObservation / hypothesis / action

Do not let one chart carry the whole story.

Showing the complete evidence sequence.

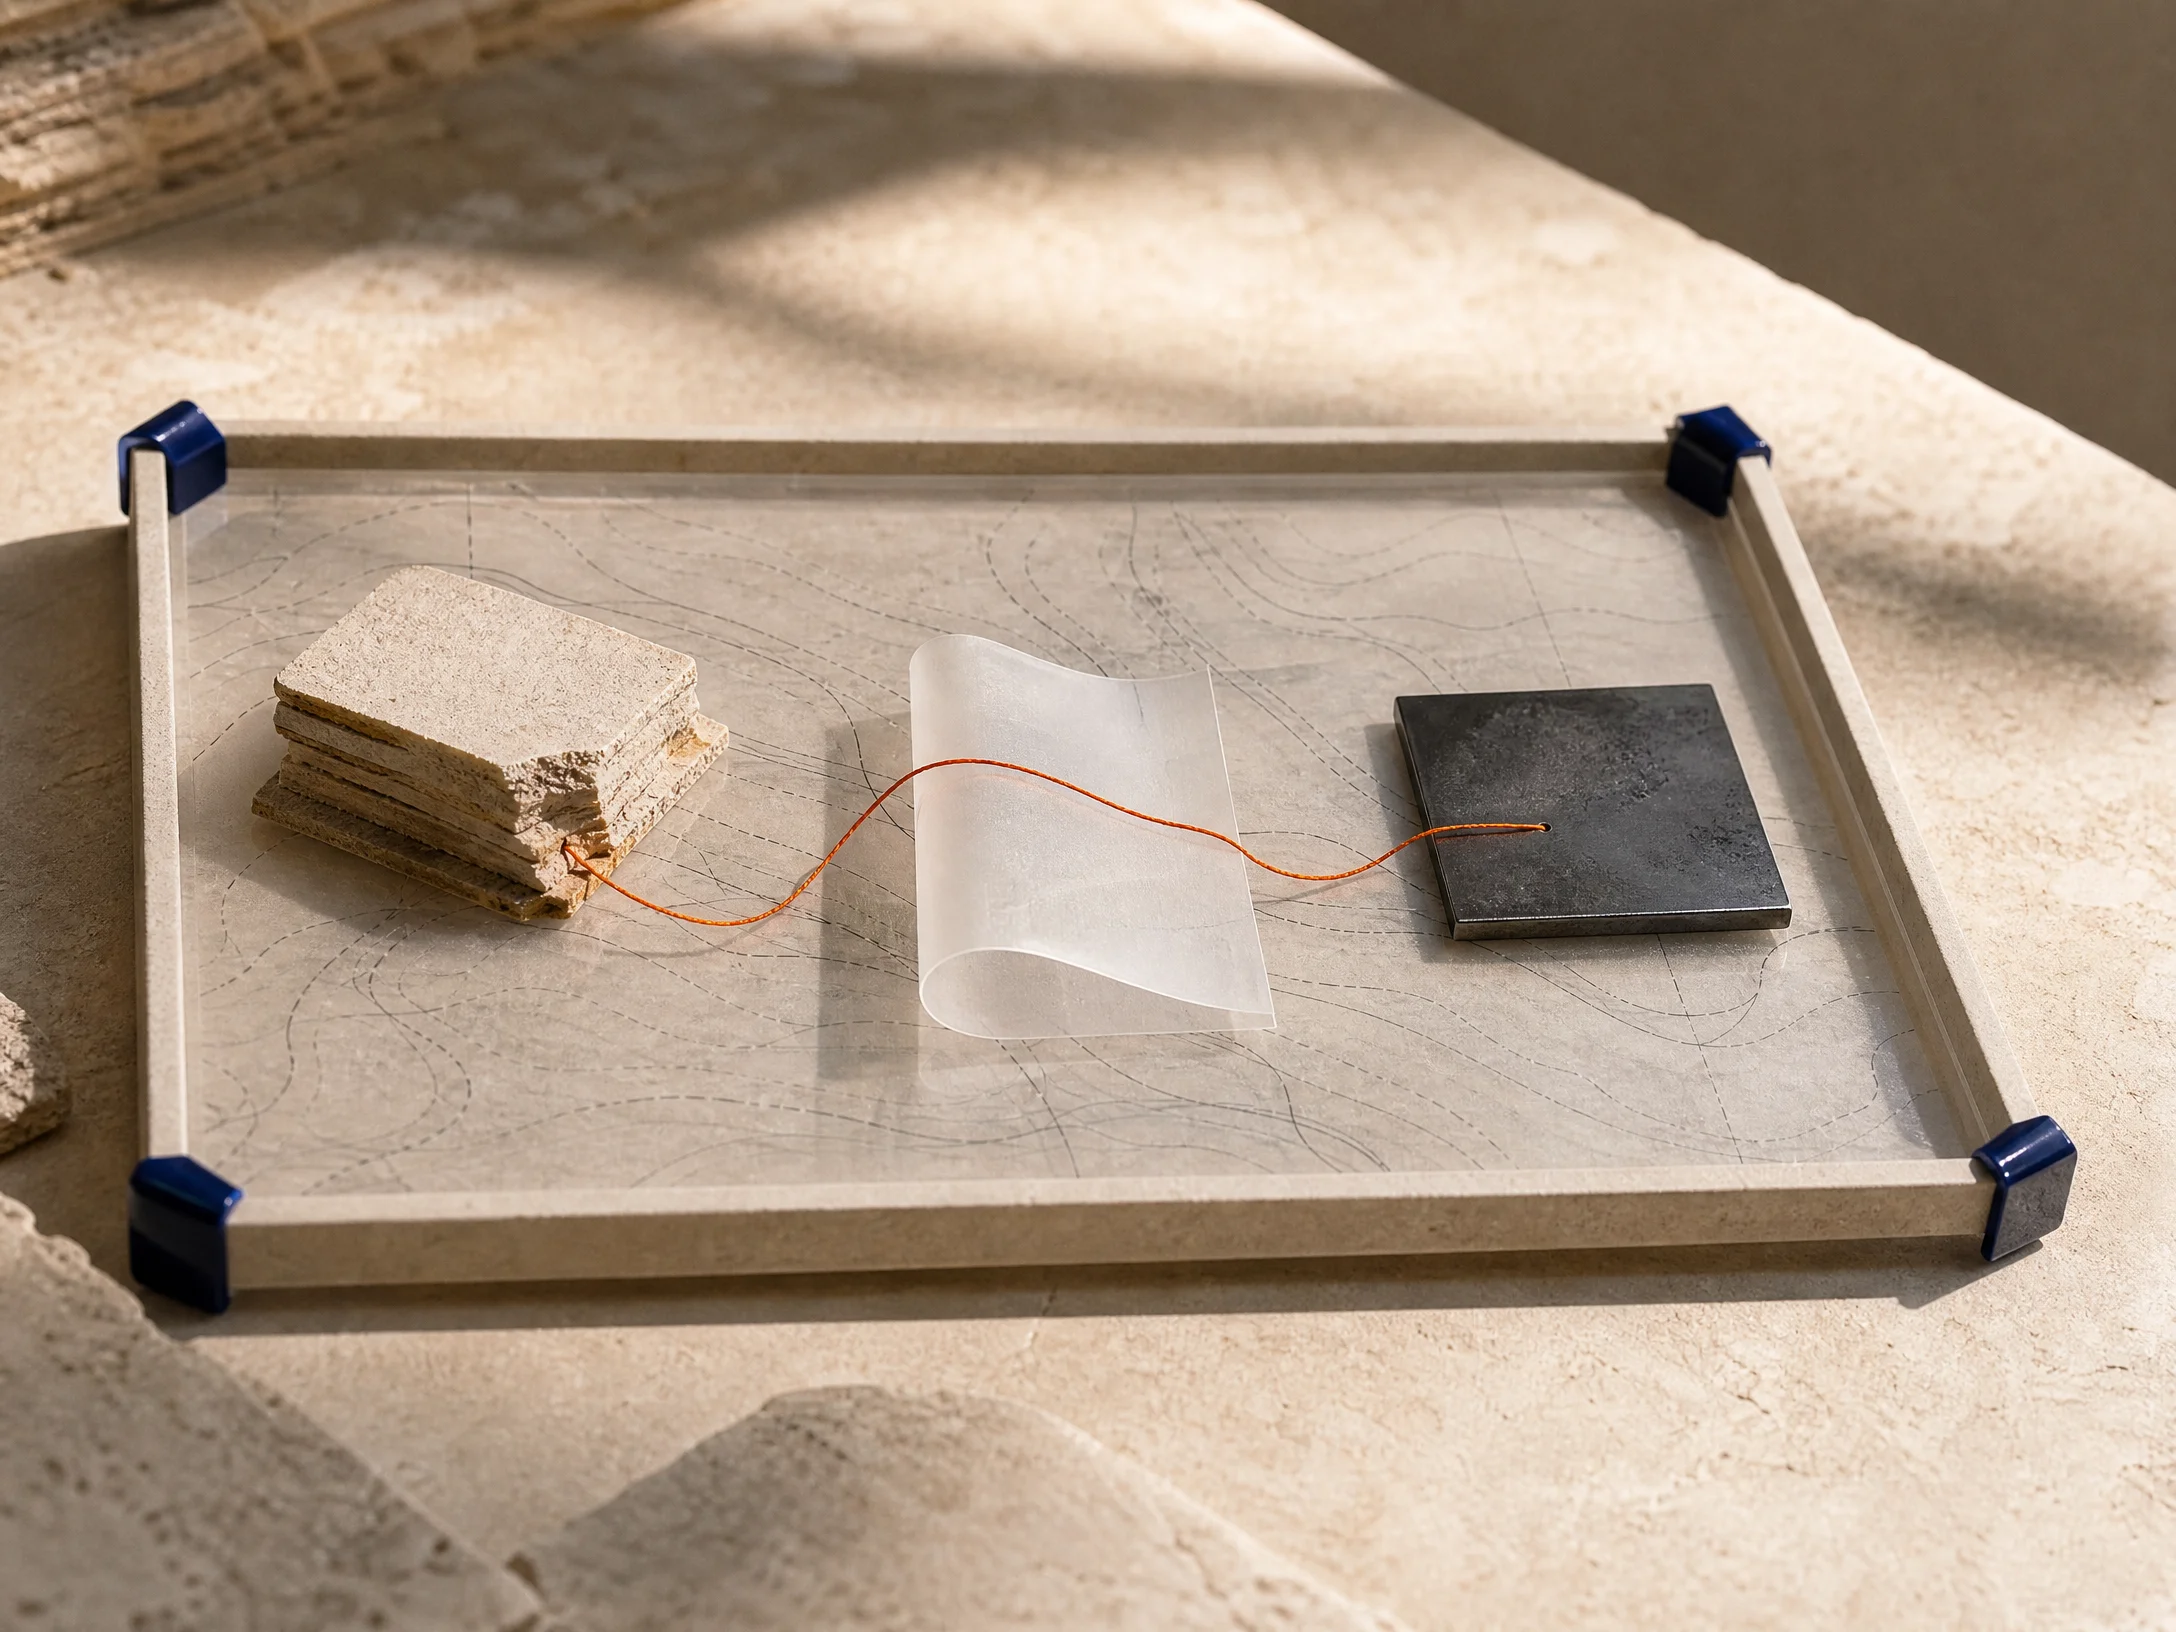
Evidence sample on a survey board with a traced signal
Observe

Describe the movement without naming a cause.

Record where the shift appears, where it does not and what the source cannot see.

Physical fault model used to compare competing explanations
Test

Place rival explanations beside the same evidence.

Change one condition while keeping the comparison readable.
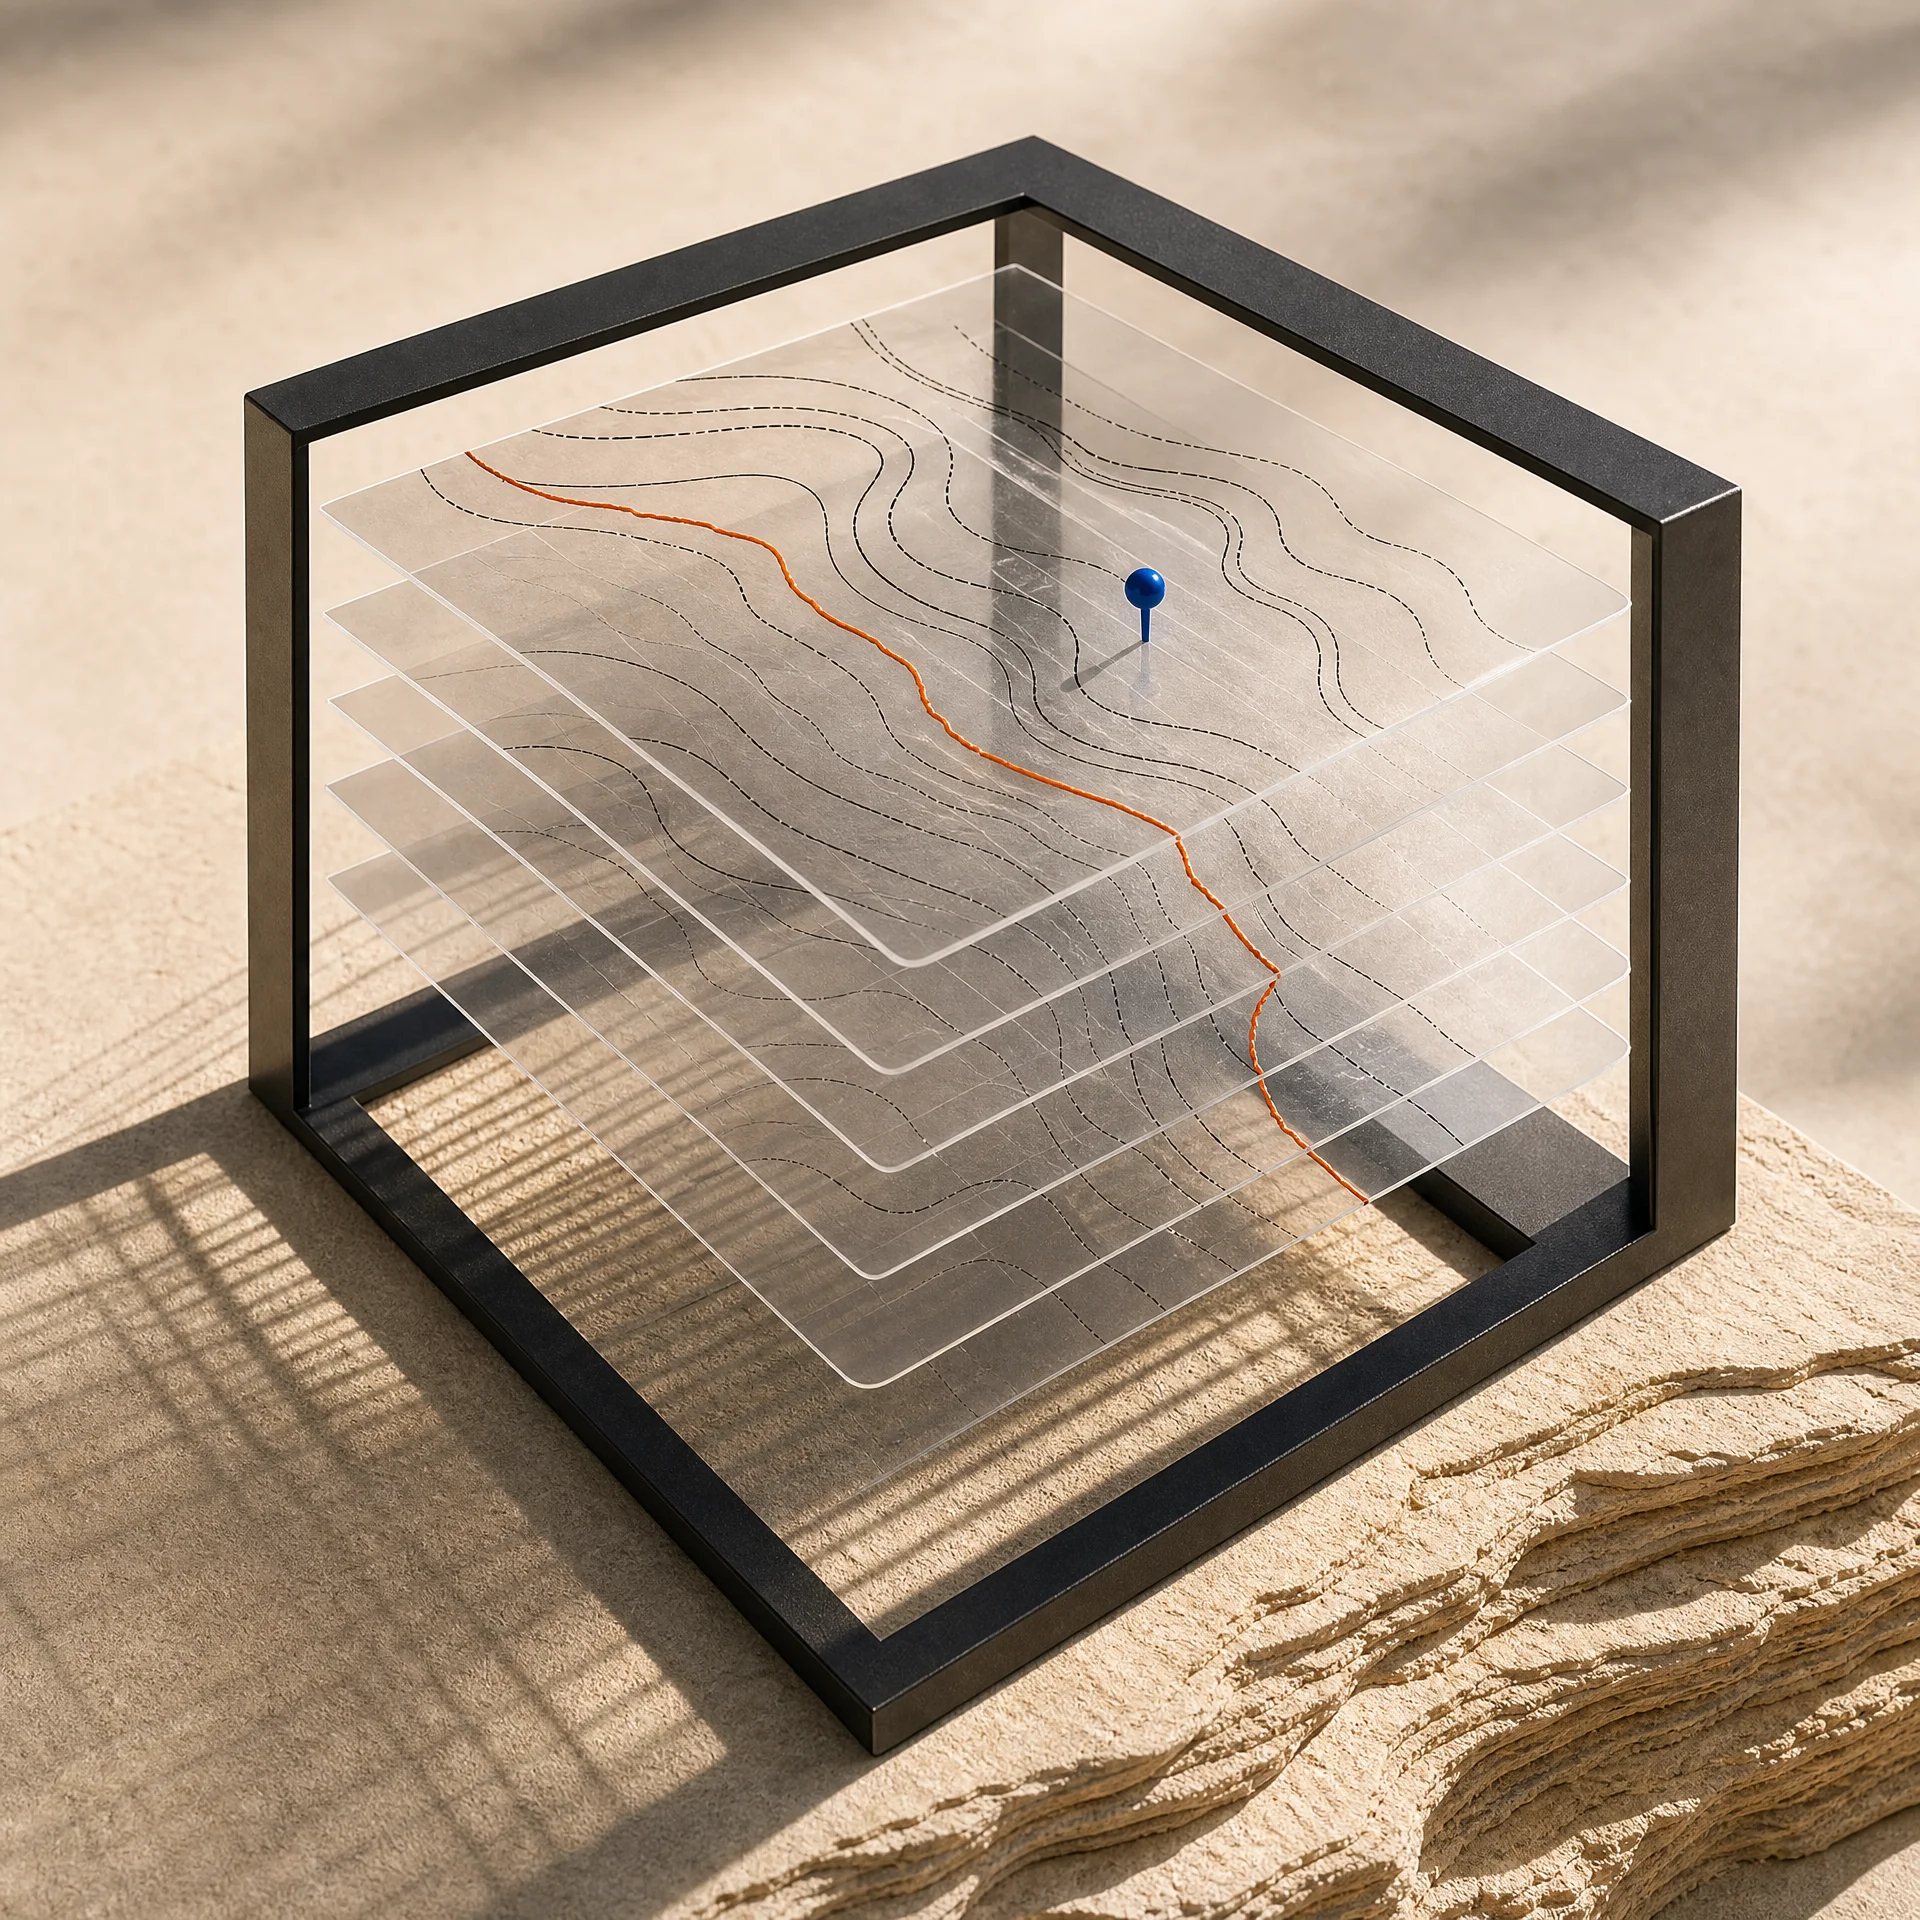
Transparent contour window framing a decision boundary
Decide

Define the boundary before the result arrives.

Agree on the action, owner and review date while the evidence is still neutral.

Threshold fieldSet the boundary first

How much movement is enough to change the plan?

Move the threshold to see how the recommended response changes. This is a planning aid, not a statistical claim.

Review thresholdRun one controlled comparison before reallocating effort.

Required evidence: stable tracking, one comparison group and a named review window.
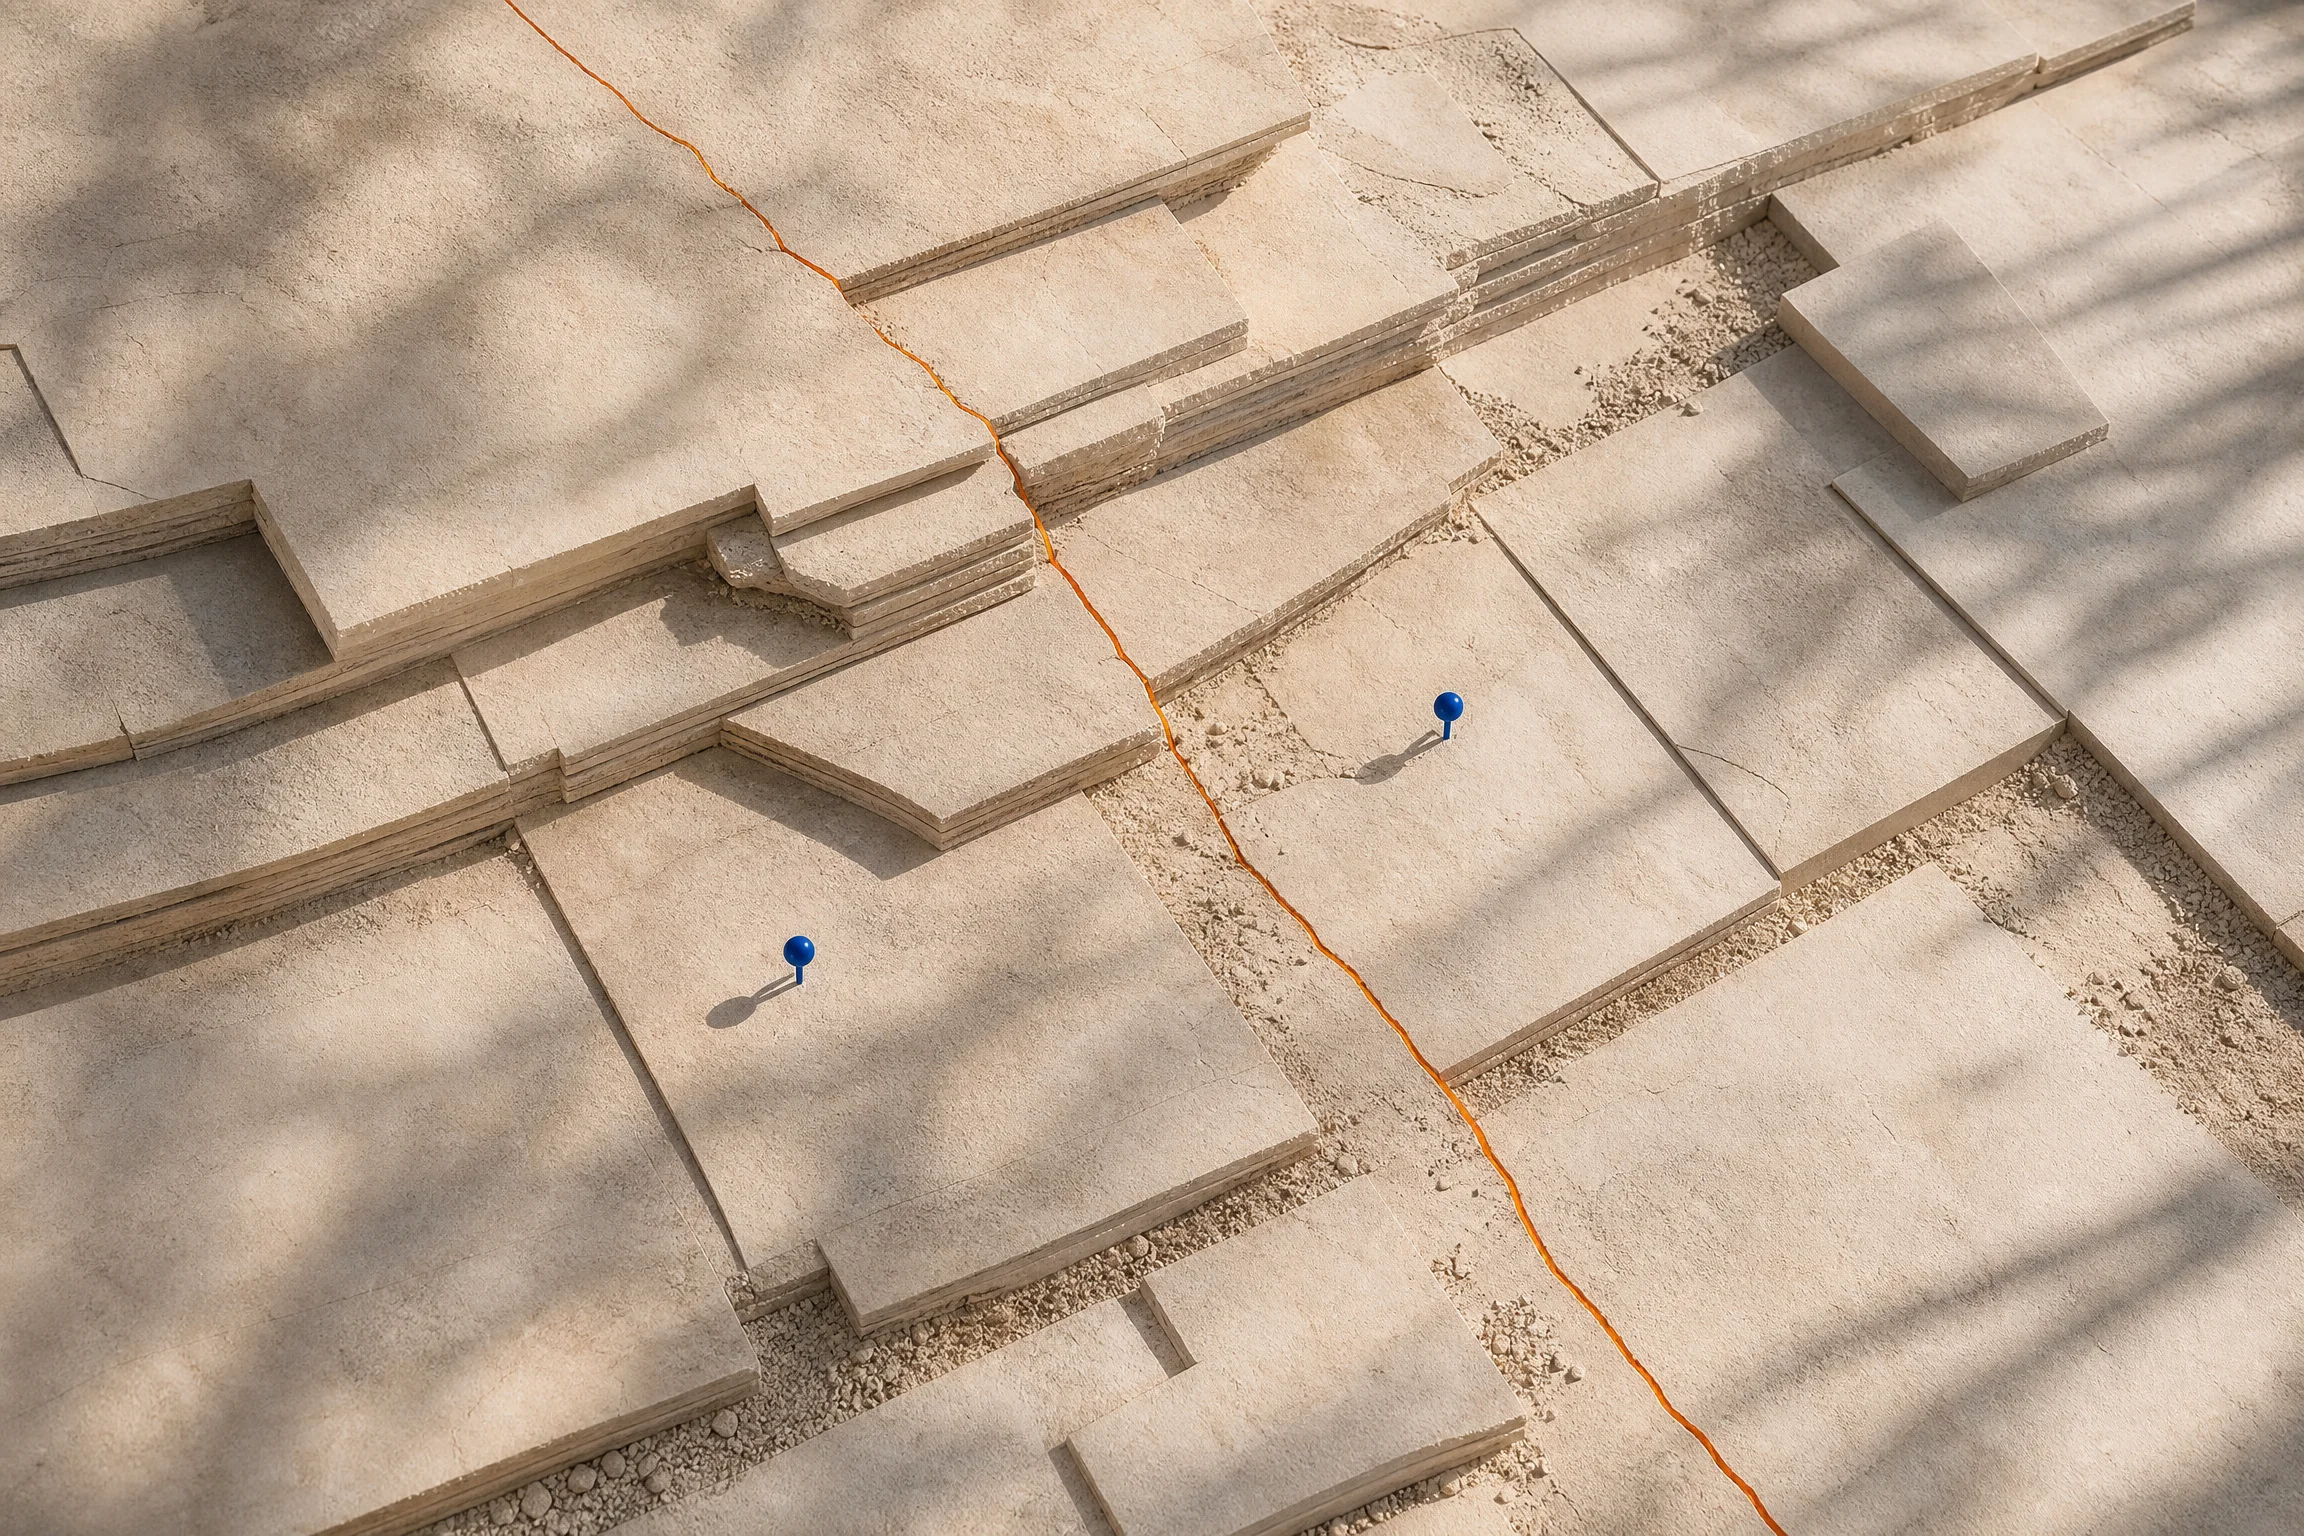
Mapped threshold field showing a fault line and survey pins
Boundary mapSignal before cause
Transparent contour frame isolating a decision area
Contour windowDecision boundary
Open decision ledger with mapped fault line and survey markers
Decision ledgerWrite before reporting
Decision ledgerThree entries

Turn the reading into an operating routine.

  1. 01
    Question

    Write the decision and the alternative explanations.

  2. 02
    Evidence

    List the source, blind spots and stable comparison.

  3. 03
    Action

    Name the owner, threshold and next review date.
Marketing measurement survey desk with maps, samples and drawing tools
Survey deskContact / working brief
Field briefStart with one decision

What marketing question needs a clearer field map?

Share the decision, the evidence you already have and the uncertainty that keeps returning. We will reply with the most useful first review—not a generic dashboard pitch.

[email protected]
Field brief recorded. We will reply using the email you provided.
Field questionsBefore the survey

Clarify the method before adding more instrumentation.

Do you replace our reporting stack?

No. The work starts with the decision and the evidence already available. New instrumentation is suggested only when an important blind spot blocks a clear comparison.

How do you handle attribution limits?

We document what each source can and cannot identify, then design a bounded comparison. The result is a decision range rather than a claim that one model sees everything.

What makes a useful baseline?

A useful baseline is stable enough to compare and close enough to the current decision. It may be a prior period, unchanged audience, channel holdout or operational benchmark.

Can qualitative evidence join the field map?

Yes. Search language, sales conversations and customer interviews can explain where to investigate. They remain labelled as qualitative signals rather than being converted into false precision.

What should we prepare for a first review?

Bring the decision, current reports, source definitions and any known tracking changes. A short list of competing explanations is often more useful than a larger export.

Does a field brief guarantee an outcome?

No. Bipaqero helps structure evidence, comparisons and decision ownership. Results still depend on data quality, market conditions, implementation and the choices made by your team.

No matching field question.Try a shorter term such as “baseline”, “attribution” or “evidence”.